
Gymnastics in London · Annual research report
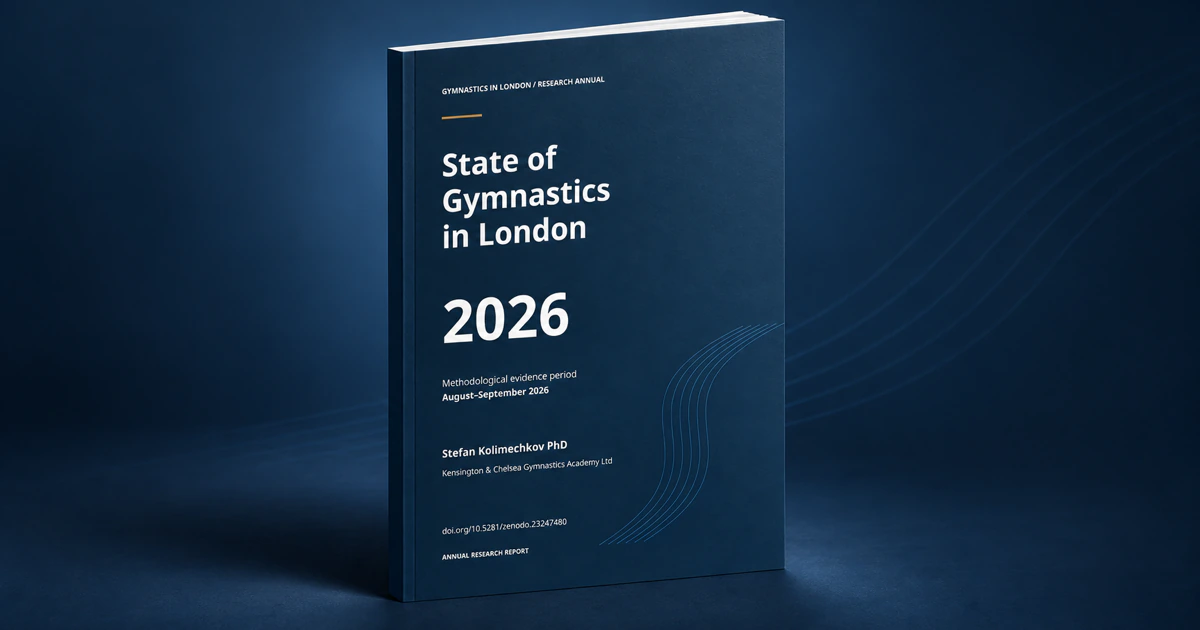
State of Gymnastics in London 2026
The first controlled London-wide baseline of publicly identifiable gymnastics provision across Greater London.
The report documents organisations, physical delivery locations, advertised offers and delivery relationships across all 33 local-authority areas, while keeping evidence limitations and unresolved cases visible.
Executive summary
The London baseline
Four connected units describe the recorded system. They answer different questions and must not be added together or treated as interchangeable measures.
- 163
- Providers — distinct current stable delivery organisations
- 247
- Physical Venues — qualifying current delivery locations
- 1,131
- Programmes — eligible current advertised offers
- 261
- Provider–Venue delivery links represented by current Programmes
Frozen research snapshot. “Current” means current within the August–September 2026 research snapshot. It is not a promise of continuously updated availability and the report is not a booking service.
Published area evidence
Physical Venue supply across London
Choose an area to read its published physical Venue count, resident population, population-referenced rate and unresolved-candidate qualification from Supplementary Table S1.
With JavaScript enabled, use arrow keys to move between areas and Enter or Space to select. The selector and complete list provide equivalent access.
This page summary uses a continuous, unclassed scale. Darker shading is not a performance category and does not establish greater access, capacity, availability or quality. Interface boundaries are generalised from the Greater London Authority dataset under the Open Government Licence v3.0 and contain OS data © Crown copyright and database right 2026. The report’s Figure 1 and full methodological attribution remain authoritative.
View all 33 published area profiles
- Barking and Dagenham8 physical Venues · 3.36 per 100,000 residents238,295 residents · 3 unresolved candidates
- Barnet13 physical Venues · 3.19 per 100,000 residents408,087 residents · 1 unresolved candidate
- Bexley6 physical Venues · 2.33 per 100,000 residents257,103 residents · 1 unresolved candidate
- Brent4 physical Venues · 1.14 per 100,000 residents352,201 residents · 5 unresolved candidates
- Bromley18 physical Venues · 5.36 per 100,000 residents336,048 residents · 3 unresolved candidates
- Camden6 physical Venues · 2.77 per 100,000 residents216,658 residents · 1 unresolved candidate
- City of London0 physical Venues · 0.00 per 100,000 residents15,631 residents · 0 unresolved candidates
- Croydon9 physical Venues · 2.19 per 100,000 residents410,085 residents · 1 unresolved candidate
- Ealing10 physical Venues · 2.58 per 100,000 residents387,072 residents · 7 unresolved candidates
- Enfield4 physical Venues · 1.21 per 100,000 residents329,400 residents · 9 unresolved candidates
- Greenwich6 physical Venues · 1.99 per 100,000 residents301,225 residents · 3 unresolved candidates
- Hackney6 physical Venues · 2.25 per 100,000 residents266,241 residents · 0 unresolved candidates
- Hammersmith and Fulham11 physical Venues · 5.78 per 100,000 residents190,216 residents · 4 unresolved candidates
- Haringey13 physical Venues · 4.88 per 100,000 residents266,218 residents · 1 unresolved candidate
- Harrow7 physical Venues · 2.57 per 100,000 residents272,612 residents · 6 unresolved candidates
- Havering6 physical Venues · 2.14 per 100,000 residents280,787 residents · 0 unresolved candidates
- Hillingdon5 physical Venues · 1.53 per 100,000 residents326,671 residents · 7 unresolved candidates
- Hounslow7 physical Venues · 2.34 per 100,000 residents299,486 residents · 5 unresolved candidates
- Islington10 physical Venues · 4.45 per 100,000 residents224,551 residents · 4 unresolved candidates
- Kensington and Chelsea8 physical Venues · 5.49 per 100,000 residents145,734 residents · 4 unresolved candidates
- Kingston upon Thames11 physical Venues · 6.37 per 100,000 residents172,761 residents · 0 unresolved candidates
- Lambeth7 physical Venues · 2.23 per 100,000 residents314,298 residents · 1 unresolved candidate
- Lewisham3 physical Venues · 1.00 per 100,000 residents301,037 residents · 2 unresolved candidates
- Merton12 physical Venues · 5.48 per 100,000 residents218,891 residents · 0 unresolved candidates
- Newham5 physical Venues · 1.33 per 100,000 residents376,542 residents · 2 unresolved candidates
- Redbridge6 physical Venues · 1.86 per 100,000 residents321,829 residents · 1 unresolved candidate
- Richmond upon Thames15 physical Venues · 7.63 per 100,000 residents196,713 residents · 0 unresolved candidates
- Southwark6 physical Venues · 1.92 per 100,000 residents312,366 residents · 1 unresolved candidate
- Sutton6 physical Venues · 2.80 per 100,000 residents213,972 residents · 0 unresolved candidates
- Tower Hamlets5 physical Venues · 1.50 per 100,000 residents334,240 residents · 2 unresolved candidates
- Waltham Forest3 physical Venues · 1.06 per 100,000 residents283,713 residents · 1 unresolved candidate
- Wandsworth8 physical Venues · 2.35 per 100,000 residents339,859 residents · 2 unresolved candidates
- Westminster3 physical Venues · 1.41 per 100,000 residents212,367 residents · 1 unresolved candidate
What the report establishes
A common factual reference—not a league table
The report creates a shared starting record with explicit units, complete geography, governed category evidence and visible uncertainty.
Verified presence in 32 areas
Physical Venue supply was verified in 32 of the 33 areas. The City of London’s controlled zero follows a completed search and does not mean residents have no opportunity elsewhere.
Counts and rates belong together
Each area’s physical Venue count sits beside its Mid-2025 resident population and the displayed rate per 100,000 residents. The rate is not a target, threshold or performance score.
18 governed discipline categories
The complete matrix records whether an eligible current Programme in each category was publicly identified. Non-identification must not be rewritten as “not offered” or “unavailable”.
How to read the findings
What the baseline does—and does not—measure
The report describes publicly identifiable provision admitted under common rules. It does not turn a supply profile into a judgement about individual access or service adequacy.
Supply, not capacity
The measures do not establish available places, waiting lists, operating hours, demand, attendance, affordability or service quality.
Observation, not causation
The frozen edition describes what was publicly identifiable in the stated period. It does not explain why areas differ or establish change over time.
Uncertainty stays separate
The 78 unresolved plausible candidates across 26 areas are not confirmed additional Venues and are not added to verified supply.
Evidence quality
Complete research fields, bounded knowledge
These completeness statements describe the included research records and controls. They are not estimates of the proportion of every real-world activity discovered.
- 33/33
- Planned full-area searches reached their governed completion state.
- 247/247
- Included physical Venues have an administrative-area assignment and recorded coordinate.
- 1,131/1,131
- Eligible Programmes are linked to included Venues and have a governed discipline classification.
- 33/33
- Every area has the required official resident-population denominator.
Inside the publication
From public summary to complete supporting evidence
- Report identity and purpose03
- Executive summary: the London baseline04
- What this State report measures06
- Physical Venue supply across London09
- Discipline composition13
- Evidence quality, uncertainty and limitations14
- The contribution and uses of the evidence17
- Methods and Evidence20
- Data Definitions and Interpretation Guide25
- Supplementary Tables S1–S336
Public value
A shared starting point for better questions
The same evidence serves different readers, provided that its definitions and limits travel with the findings.
Families and the wider public
Locate an area, understand what each count describes and see which categories entered the public evidence before seeking current information from individual organisations.
Local authorities and sport organisations
Use a consistent factual reference for framing further questions about provision, while recognising that investment and adequacy decisions require additional local evidence.
Coaches and Providers
Read a neutral account of how organisations, advertised offers and delivery locations are represented without promotion or endorsement of individual services.
Researchers
Inspect the published profiles, rate arithmetic, category matrix and evidence qualifications within the stated boundary of aggregate reproducibility.
Publication integrity
Authorship, review and reuse
Declared author interests
Stefan Kolimechkov is the programme’s author and researcher, a gymnastics coach and gymnast, and KCGA’s Founder and Director. KCGA is represented in the Dataset under the same inclusion and analytical rules as other Providers.
Independent expert review
Associate Professor Iliya Yanev reviewed the report’s scientific presentation, methodology as presented, interpretation, limitations, terminology, usefulness and accessibility. This is not journal peer review or formal validation of the underlying Dataset.
Licence and component rights
The original text and disclosure-cleared author-owned contributions are licensed under CC BY 4.0. Official statistics, geography and other third-party components retain their own rights and terms.
Cite this report
Kolimechkov, S. (2026). State of gymnastics in London 2026. Kensington & Chelsea Gymnastics Academy Ltd. https://doi.org/10.5281/zenodo.23247480
The wider research programme
One dated baseline within Gymnastics in London
The 2026 State is preserved as its own frozen research record. Future editions require separately specified research waves and should distinguish new observation, correction and methodological change.